Exploring the DataSet

The dataset that is used in our study is from the Swiss Federal Office of Statistics (SFOS). The dataset contains official monthly released information about arrivals in Switzerland hotels from January 2009 to December 2020.

From which countries Switzerland hotel visitors originate from?

Here are the Top 10 arrivals in Switzerland hotels per country during the year 2018. It is observed that most of the arrivals from Europe come from neigboring countries. Regarding the rest of the world, the most arrivals originate from: the United States of America, China, South Korea and India. This gives a good indicator on where (which country) and in which language the Google Trends must be chosen. However, it is notable to obsevre that China must be discarded as Google is not used in this country

How did the arrivals behaved during the covid crisis period?

In the following plot is presented the monthly number of arrivals from 2018 to 2020, during the covid 19 crisis period, in Germany. It is clear that the arrivals drasticly decrease in 2020 during the months of March, April and May. Moreover, as Germany is a neighbor country of Switzerland, it highlights even more the scale of the crisis.

To sum-up, let's visualize the difference between 2018 and 2020

To visualize more clearly the difference between year 2020 and 2018, here are two maps representing the countries of arrivals in Switzerland accross the word We observe in these maps the contrast between the covid crisis period in 2020 and the arrivals in a 'normal' year; 2018 in that case. Indeed, asian countries are totaly absent of the 2020 map representaton.

Baseline model and Google Trends

The baseline model that we use to predict the arrivals is a simple Auto-Regressive model of order 2. To select the lags (features) that interest us, we use a PACF plot (plotted bellow).

How to select the lags of our base model?

From the partial autocorrelation function(which instead of finding correlations of present with lags like ACF, finds correlation of the residuals which remains after removing the effects which are already explained by the earlier lags) with the next lag value some lags that have a big autocorrelation coefficient are selected. The best lags are selected for the base model (without including the Google trends). The idea is to find the best two lags in order to have a base model that fit well the true data wothout overfitting (that's why only two lags are selected).

To do so, the mean absolute error (MAE) between the model predictions and the true data of all the different models (which have different lags) are compared during three periods : the testing set without the crisis (from 2015/3/1 to 2020/2/1); the crisis only (.from 2020/2/1 to 2020/10/1); the whole testing set(2015/3/1 to 2020/10/1). Ideally this model will be further improved by adding the Google trends. To have an idea of how an autoregressive model behave, an AR model with only one lag is first evaluated, firstly with *t-1* and then with *t-12*. This gives an idea about the influence of these two lags.

Which google trends are useful in predicting hotel arrivals in Switzerland?

An analysis on the Trends showed that the most interesting Trends are :

The three best trends were selected based on their p-values. A feature is considered good (i.e. worth using in the model) if it has a low p-value. Indeed, a low p-value means that it has low chances to happen under the null hypothesis. Here, the null Hypothesis would be "the Trends data is not an indicator of the number of hotel nights sold".

Is it possible to find better trends using web-scraping ?

Before using Trends to improve the model, the right question to ask is : what trends keywords should be used ? Trends should reflect what people are interested in before coming to Switzerland for a touristic purpose. Thus, articles about tourism are scraped from the web. In information retrieval, TFIDF, short for term frequency–inverse document frequency, is a numerical statistic that is intended to reflect how important a word is to a document in a collection or corpus. This method was used to produce a list of trends keywords.

This list of keywords served as a proposition to choose the right features. 
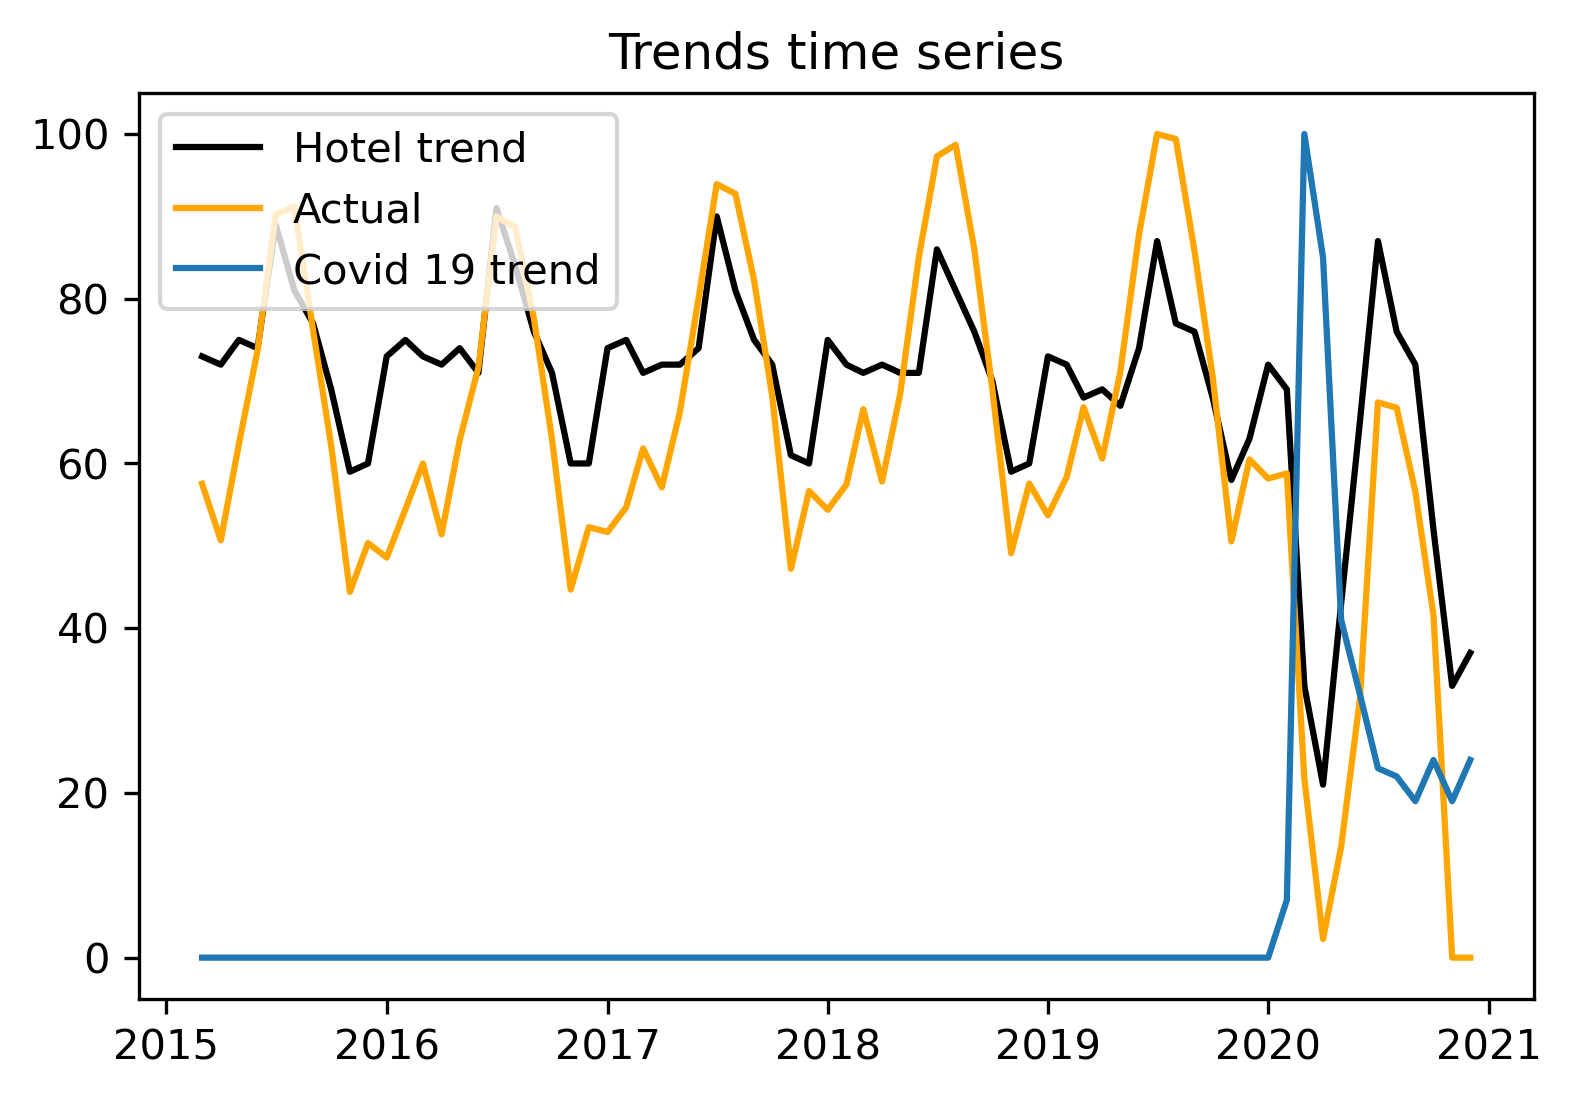
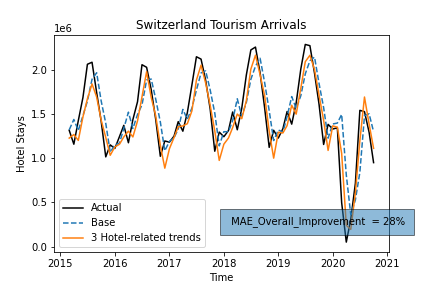
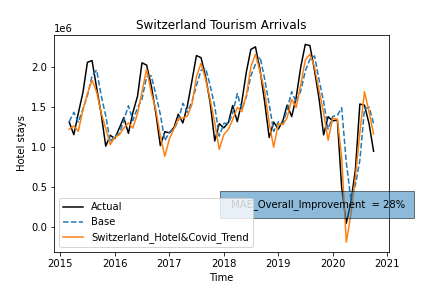
A list of relevant keywords is chosen following some tests. To get the Google Trends by country more relevantly we translate them into respective majority language. Some keywords are relevant rather in some countries than others. Summing these Trends and plotting them allows us to follow the interest in swiss tourism through the years.

Is it possible to use covid-related Trends ?

Trends related to hotel reservation improved the quality of the model and thus build a strong long-term model to predict hotel-stays in Switzerland. However, in the context of the corona crisis, it might be useful to include covid-related trends. Feature engineering techniques showed that the most significant keyword is simply ‘covid19’. However, after including it to the model, the MAE improvement was 28% compared to the base model. Compared to the 28% improvement with only hotel-related Trends, this does not bring any improvement.

It can be explained by two main reasons : The ‘covid19’ interest rose in a violent spike going from minimum to maximum in the span of two month. This sharp change does not bring much valuable information compared to the long-term tendency of hotel-trends Covid is a new trend and there are only a few months to train on. There is a lack of data This project must lead to answers to these questions Which google trends are useful in predicting hotel arrivals in Switzerland ? Will google trends make more accurate predictions in the context of the COVID-19 crisis than the official statistics of the Switzerland Federal Office of Statistics (which are monthly released)?

Conclusion

In conclusion, the prediction of hotel arrivals can be greatly improved with the inclusion of Google Trends data. The choice of keywords is crucial to the performance of these predictions. Many selection methods are available. The use of web scraping and TFIDF allows us to reveal intuitive and insightful keywords. Using a simple auto-regression prediction method, we obtained powerful results of 28% improvement in comparison with the base model.